We’re Going Streaking! In Stocks…With Clothes On.
January 30, 2026
The map is not the territory.
—Alfred Korzybski
Markets tend to test discipline in different ways over time. Periods of rapid change make investors crave adaptability, while periods of persistence make them want patience. Neither suggests something is wrong, but both can challenge the instinct to assign meaning to every market move.
Recently, market trends have been on a positive streak for longer than many investors might have expected. Extended stretches like these often invite interpretation. Yet, history shows that duration alone provides limited insight into what comes next.
At Warren Wealth Management, our approach is designed with this reality in mind. Rather than drawing conclusions from the length of a market move, we rely on a systematic investing process that evaluates market behavior objectively and adjusts as conditions evolve. This framework allows portfolios to remain aligned with prevailing trends without requiring precise forecasts or discretionary timing decisions.
This month’s Note provides historical context around extended market trends and explains why discipline remains essential both when markets are steady and when they are changing.
But first, here’s a summary of what transpired in the markets in January.
Asset Allocation Update

Source: Blueprint Investment Partners
Adjustments can vary across strategies depending on each strategy's objectives. What's illustrated above most closely reflects allocation adjustments for the Growth Strategy. Diversification does not guarantee investment returns and does not eliminate the risk of loss. Diversification among investment options and asset classes may help to reduce overall volatility.
U.S. Equities
Exposure will not change and remain overweight. Both the intermediate- and long-term trends are positive.
International Equities
Exposure will not change, with both foreign developed and emerging market equities remaining at their baseline allocation. Trends continue to be positive across all timeframes.
Real Estate
Exposure will not change and remain at its minimum.
U.S. & International Treasuries
International Treasuries are now in an intermediate-term uptrend, resulting in an increase from a minimum allocation to a baseline position, while remaining underweight. U.S. Treasuries have a mix of uptrends and downtrends, with nearer-term trends now being negative and long-term trends remaining positive.
Inflation-Protected Bonds
Exposure will be at its minimum. The intermediate-term trend is negative, and the group remains weaker than other fixed income assets.
Alternatives
Short-Term Fixed Income
Exposure will increase slightly as this asset class takes on vacated exposure from U.S. Treasuries.
Asset-Level Overview
Equities & Real Estate
The S&P 500 Index has followed a similar script in January as it did in December: a strong opening, an intra-month swoon, and ending with a positive close. Like the previous month, there was a serious test of the 50-day exponential moving average. And just like the prior month, there was yet another new all-time high. Trends are positive across all timeframes, and U.S. equities will remain overweight in our portfolios.
Like we saw throughout much of 2025, foreign developed and emerging market equities have kicked off the new year by continuing to outperform their U.S. counterparts. After a fresh round of new all-time highs for both, trends remain positive across all timeframes and each is fully allocated in our portfolios.
Real estate securities started to produce the earliest signs of uptrends, but a pullback in the latter half of January has the asset class at risk of falling back into downtrends. The lack of conviction and continued weakness relative to other equity assets means it will remain at its minimum allocation in our portfolios. The exposure typically reserved for real estate will continue to be held within the much-stronger U.S. equity bucket.
Fixed Income & Alternatives
Much like real estate, with its sensitivity to interest rate levels and direction, U.S. fixed income prices continue to drift – mostly sideways. After positive performance for much of 2025, the last month or so has seen this asset mostly move lower. Once-solid trends have wobbled, with intermediate-term trends now generally being negative while long-term trends are still positive.
When all the calculations are complete and relative weakness in inflation-protected bonds and parts of international fixed income is accounted for, the result is that U.S. fixed income exposure will decrease in our portfolios.
International fixed income, however, has improved. Intermediate-term trends are now positive, resulting in exposure increasing, while remaining underweight.
Within the alternatives allocation, fixed income remains the largest allocation, though its influence has been reduced following a shift to a slightly net short position. As a result, its contribution now trails equities and international currencies, as well as certain commodity segments such as precious metals. Equities remain the top influence and have increased as January winds down. The overall net long position in commodities is increasing, with net long exposure to metals outweighing an increase in net short positions in grains.
Sourcing for this section: CNBC.com, “S&P 500 closes at a record Tuesday as tech giants rally: Live updates,” 1/27/2025; Barchart.com, FTSE All-World Ex-US ETF Vanguard (VEU), 3/9/2007 to 1/28/2026; and Barchart.com, FTSE EM ETF Vanguard (VWO), 3/11/2005 to 1/28/2026
3 Potential Catalysts For Trend Changes
Fed Notes: Wednesday, January 28th, the Federal Reserve decided to keep interest rates steady, showing little urgency to cut them again after making reductions at the last three meetings. The benchmark federal funds rate will stay between 3.5% and 3.75%, with the decision passing by a 10-2 vote. Fed Chair Jerome Powell said recent data looked a bit better than before, with stronger economic growth and some signs that the job market is stabilizing. Although job growth has slowed a lot over the past year, the unemployment rate has leveled off. Some officials, including Powell, are now more willing to ignore price increases caused by tariffs, expecting these to be temporary. Others remain concerned because inflation has stayed above the Fed’s 2% target for five years. Powell also said officials are cautious about declaring victory over inflation, especially if companies are still determined to pass on higher import costs, even if they have not done so quickly.
Confidence vs. Sentiment: In January, consumer confidence fell to its lowest point in more than 10 years, according to The Conference Board’s survey. This suggests that the recent period of steady economic data could still be fragile. However, the University of Michigan’s monthly sentiment survey found that people felt a little more positive about the economy in January, an improvement from the very low levels seen late last year. Inflation has fallen sharply during the past three years, but it is still above the long-term average, and consumers are frustrated by the price increases that have already occurred. Many are also worried about fewer job opportunities. A representative from The Conference Board reported, “References to prices and inflation, oil and gas prices, and food and grocery prices remained elevated. Mentions of tariffs and trade, politics and the labor market also rose in January, and references to health/insurance and war edged higher.”
Housing Trap: Many renters hope home prices will drop so they can finally buy a home, while many current owners want prices to stay high. These conflicting interests make it difficult for policymakers to help young Americans in today’s tough housing market. If home prices and mortgage rates stay the same, the median household income would need to rise by 56% to $132,000 to make homes as affordable as they were six years ago. Although wages are rising faster than home prices, it could still take about 10 years for incomes to catch up. Alternatively, mortgage rates would need to fall to 2.65% to give buyers the same purchasing power they had in 2019, which is unlikely unless there is a major recession. Lower rates could also push home prices higher unless more are built. The third option to return to 2019 affordability is for home prices to drop by 35%.
Sourcing for this section: The Wall Street Journal, “Fed Holds Rates Steady for First Time Since July,” 1/28/2026; The Wall Street Journal, “Consumer Confidence Dropped to 12-Year Low in January, per Conference Board,” 1/27/2026; The Wall Street Journal, “Consumer Sentiment Improved in January, Michigan Survey Finds,” 1/23/2026; and The Wall Street Journal, “To Make Homes Affordable Again, Someone Has to Lose Out,” 1/20/2026
Putting the S&P’s Streak Into Historical Context
All models are wrong, but some are useful.
—George E. P. Box
As the S&P 500 Index extends its intermediate-term uptrend into a tenth-straight month, it may cause some to wonder if the market is overextended and due for correction. While it is difficult to pin down a precise definition for overextended, as a believer in the value of systematic asset management, we are hardwired to go to the data to get some clarity, understand where this current stretch ranks, and gain historical context.
We are focusing on the intermediate-term trend, which compares the 10-day exponential moving average versus the 100-day exponential moving average, because that is the most responsive timeframe we evaluate when making allocation decisions for our portfolios. Current U.S. tax laws as it relates to capital gains penalizes shorter-term gains in taxable investment accounts, meaning that a system needs to provide superior returns to target shorter timeframes, all else being equal. For this and other reasons, Warren Wealth Management made a decision many years ago to target trends over timeframes that were more friendly to an investor’s tax picture while still being responsive enough to avoid potentially damaging bear markets.
For this exercise we will focus on the longest-running S&P 500 Index ETF, the S&P 500 SPDR (SPY), which dates back to 1993. While 10 months of a consistent trend is a solid stretch, those worried that it is making us overdue for a decline might be able to breathe a sigh of relief, as the current run doesn’t even crack the top 10 longest-stretches since 1993.
Longest Stretches of Positive Trends for Intermediate-Term Timeframe
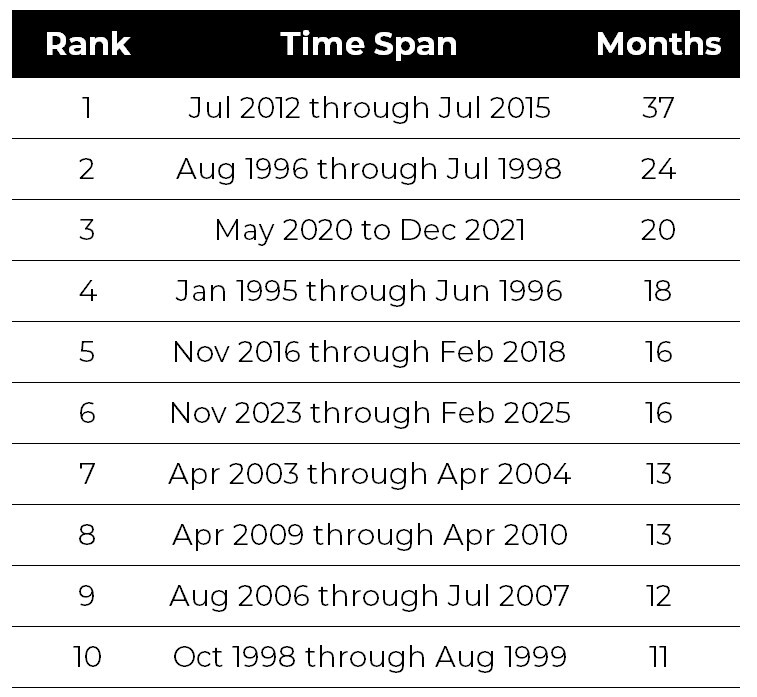
Source: Global Financial Data (GFD), SPDR S&P 500 ETF Trust (SPY), 11/1/1993 to 12/31/2025. Signal timing: Each month’s trend signal is calculated using information available as of the end of the PRIOR month (lagged by design).
Astute market historians might interpret the table above and worry. After all, if the current stretch continues another month or two, the modern-day run would start tying with the time periods that ended in August 1999 and July 2007. Those months predated the two-most-severe drawdowns in modern history: the tech bubble of the early 2000s and the Financial Crisis of 2008. And yes, the stretch of 20-consecutive months of uptrends ending in December 2021 was also immediately followed by a bear market in 2022.
However, it is also important to note that several streaks, including the longest of 37 months, did not come before large declines. In fact, after a more than three-year run that ended in July of 2015, sure 2016 was not a banner year for stocks, but 2017 was a great one that included its own streak of 16 months.
Yes, long streaks can be precursors to decline but it is more correlation than causation. It is data but not information. What we mean by this is that one should not use the current streak in markets as a criteria in deciding what to do next. Many great returns can be missed, in our opinion, by trying to guess when a market run is over. Alternatively, opportunities may be overlooked when investors are skeptical of a market that has declined but is slowly trending up.
In closing, for us the story is the same as always: develop an investing process and stick to said process. It’s not perfect but it’s repeatable and continues to work, in our view.
With frigid temperatures recently gripping a large part of the country, it reminds us of one of our favorite analogies: it is better to fit the markets like a mitten than a glove. Sure, you won’t ever have a perfect fit, but you will generally be protected from the cold. Stay warm, everyone — in life and investing!
Let's Talk
If you have any questions about what transpired in the markets last month or portfolio positioning for the month ahead