
After-Election Expectations
October 30, 2026
We will continue to ignore political and economic forecasts, which are an expensive distraction for many investors and businessmen.
—Warren Buffett
Every election seems to come with a market forecast attached. Which sectors win. What happens to rates. Whether stocks rally or sell off once the votes are counted.
It’s easy to confuse the outcome we want with the one we think markets will reward.
To successfully investing based on that view means you’d have to do more than pick the winner. You would need to know who controls Congress. Then what they can actually get passed. Then how markets will react to all of it, and whether that reaction is already priced in. Each step is its own forecast.
We would rather respond to what markets are actually doing at any actual moment in time than depend on getting that sequence of predictions right.
This month’s Note looks at the midterm elections, what history can and cannot tell us about how markets react to them, and why a systematic investment process does not need to know the winner.
But first, here’s a summary of the global asset classes utilized in our portfolios and their exposures for November.
Asset Allocation Update
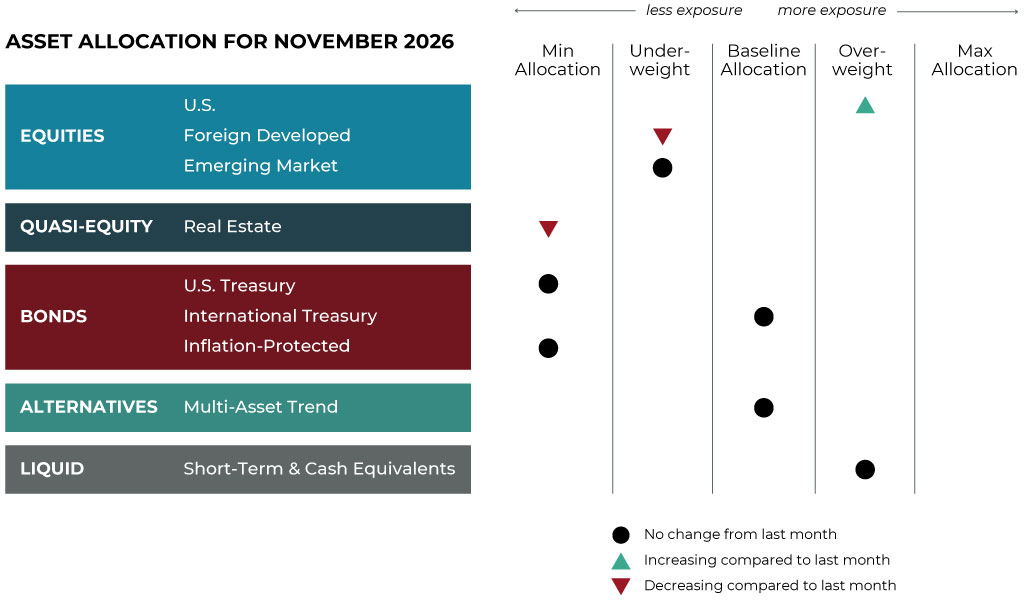
Source: Blueprint Investment Partners
Adjustments can vary across strategies depending on each strategy's objectives. What's illustrated above most closely reflects allocation adjustments for the Growth Strategy. Diversification does not guarantee investment returns and does not eliminate the risk of loss. Diversification among investment options and asset classes may help to reduce overall volatility.
U.S. Equities
Exposure will increase and remain overweight due to a combination of uptrends and taking on exposure from weakening international and real estate securities.
International Equities
Exposure will decrease and move to underweight. Both foreign developed and emerging markets are now experiencing intermediate-term downtrends.
Real Estate
Exposure will decrease and fall to its minimum allocation due to the emergence of a long-term downtrend in addition to the pre-existing intermediate-term downtrend.
U.S. & International Treasuries
Treasuries will remain underweight overall, as they continue in downtrends despite a modest rebound in October. To the extent exposure is positive, it is only due to the recently introduced adaptive fixed income ETF, which allows our strategies to seek to benefit from short allocations to bonds as prices fall.
Inflation-Protected Bonds
Exposure will remain at its minimum allocation due to downtrends across both timeframes.
Alternatives
Short-Term Fixed Income
Exposure will not change and remain overweight, as this asset class continues to hold allocations from weaker fixed-income instruments.
Asset-Level Overview
Equities & Real Estate
The S&P 500 briefly established a new all-time high in October, but the advance proved short-lived as U.S. equities returned to the sideways movement that has characterized much of the past several months. Despite the lack of sustained momentum, both intermediate- and longer-term trends remain positive. Market leadership continues to be relatively narrow, with larger companies generally holding up better than their smaller counterparts. Our portfolios will continue to be overweight, including holding allocations vacated by weaker international and real estate securities.
International equities have experienced greater weakness in October, giving back some of their impressive gains from earlier in the year. Both developed and emerging markets have faced selling pressure, with deteriorating intermediate-term momentum raising questions about the durability of their longer-term uptrends. Despite recent weakness, international equities remain among the stronger-performing asset classes this year.
Real estate securities continue to struggle under the weight of elevated interest rates. Following a particularly difficult September, the asset class remained under pressure in October as borrowing costs and Treasury yields remained near multi-year highs. With both intermediate-term and long-term trends now negative, real estate remains among the least attractive areas of the market from a trend-following perspective.
Fixed Income & Alternatives
Fixed income experienced some relief in October, following substantial losses in September, but the broader trends remain negative. The 10-year Treasury yield remains above 5%, and the Bloomberg U.S. Aggregate Bond Index was still down about 1% this year. The modest rebound has not reversed the longer-term deterioration, leaving the environment challenging for traditional bond allocations.
Within the alternatives allocation, fixed income holds the largest net position. We are short bond prices and long rates, and exposure ticked up slightly since our last update. Commodities stayed net long, though we cut long exposure sharply in every sector except energy. Equities also stayed net long, with exposure rising a bit into November. Currencies are the smallest net position and turned net long the U.S. dollar, with several positions nearly halving from last month.
Sourcing for this section: finance.yahoo.com, “The S&P 500 Just Reached a New Record. Here’s What History Says About Buying Stocks Now.,” 10/7/2026; cnbc.com, U.S. 10 Year Treasury, 10/28/2026; and loomberg.com, Bloomberg US Agg Total Return Value Unhedged USD, 1/1/2026 to 10/27/2026
3 Potential Catalysts For Trend Changes
Inflation: The Federal Reserve’s inflation measure sped up in September, raising questions about what the central bank will do next. The Commerce Department reported that prices, as measured by the personal consumption expenditures price index, rose 0.5% in September, up from 0.3% in August. The 12-month PCE inflation rate climbed to 3.6%, up from 3.4% a month earlier. When food and energy prices are excluded, core PCE inflation was still up, 0.3% in September and 3.1% during the past 12 months. The increase shows how tough the inflation problem is for the Fed. The Fed decided Oct. 28 to keep interest rates the same, but expectations are that the Fed will raise rates again at its next meeting in December. A factor in that decision is U.S. jobless claims, which stayed low in the most recent reading, defying predictions of a rise. Federal Reserve Chairman Kevin Warsh said the job market is mostly stable and unemployment is at its lowest level in generations. That fact makes it more likely the central bank will raise interest rates later this year as inflation stays above 2%.
Housing: Many factors point to a drop in U.S. home prices, except the one that really matters: owners eager to sell. Mortgage rates have risen to 7.4% for the first time since November 2023. This could be bad news for home values, especially since many more homes are for sale than three years ago. A big gap has opened between sellers and buyers in the housing market. In September, active listings showed that 1.5 million Americans were trying to sell their homes. On the other side, only 929,000 people were buying, according to Redfin estimates. The extra nearly 600,000 sellers are the largest in Redfin’s records since 2013. But owners are unlikely to lower prices enough to make housing affordable again. For now, owners don’t seem under pressure to sell. That could be because the job market is steady and typical mortgage late-payment rates are low. Moreover, owners who don’t want to lower prices are already taking their homes off the market at a record pace. In September, 6.1% of sellers removed their property after failing to get a good offer. The longer-term question is what happens to U.S. home values if mortgage rates stay at their current levels. The 30-year fixed-rate mortgage rate has averaged 7.7% since the early 1970s. Although current rates seem high by recent standards, they align with historical averages.
Net Worth: Median family net worth rose 2% from 2022 to 2025, reaching about $216,000 when adjusted for inflation, according to the Federal Reserve’s Survey of Consumer Finances. The survey comes out every three years and is considered the best way to measure household wealth. Overall wealth gains slowed from the prior period. From 2019 to 2022, wealth increased 37%, the most in the survey’s 30-plus-year history, thanks to rising stock and home prices. In the most recent report, wealth increased 37% for Americans 75 and older but dropped 23% for people under 35. During this period, people 75 and older became the richest age group, with a median net worth of $505,000. Wealth is measured as a family’s assets (e.g., stocks and home equity) minus their debts (e.g., mortgages and credit-card debt). The new data shows a two-speed economy: older, wealthier people are doing well, while ongoing inflation makes others worry about their money and the economy more broadly. Recent company earnings reports and consumer sentiment surveys have shown the same economic divide. The University of Michigan reported that its consumer sentiment index reached its second-lowest level in history. A big divide was shown between those who owned stocks and those who didn’t: sentiment among people in the top-third by stock ownership is up since the end of 2022, but sentiment among those in the bottom two-thirds and those who don’t own stocks at all has fallen.
Sourcing for this section: The Wall Street Journal, “PCE Inflation Accelerated Last Month,” 10/29/2026; The Wall Street Journal, “Stubborn Sellers Are the Last Thing Propping Up Home Prices,” 10/14/2026; and The Wall Street Journal, “Affluent and Older Americans Got Much Richer in Postpandemic Years,” 10/9/2026
The Election Will Have a Winner. Markets May Have Other Plans.
Vote with your ballot, not your life savings.
—David Booth, Founder of Dimensional Fund Advisors
As October draws to a close, investors find themselves in a familiar position: plenty of headlines, considerable uncertainty, and relatively little progress in most major markets. Since the end of May, U.S. equities have largely traded sideways. The S&P 500 briefly reached a new all-time high in early October, but that milestone masked considerable weakness beneath the surface. Many individual stocks have struggled, small-cap companies have lagged, and international equities have experienced renewed pressure after stronger performance earlier in the year.
In fact, between the S&P 500’s August and October record highs, the equal-weighted S&P 500 declined nearly 5%, illustrating how a relatively small number of large companies can support an index even as much of the broader market struggles.
Meanwhile, rising bond yields, elevated energy prices, and persistent inflation concerns have added to the uncertainty.
And now, with the November midterm elections approaching, investors have another reason to speculate about what comes next.
The stakes are significant.
If Republicans retain control of both the House and Senate, President Donald Trump would have a clearer path to advancing his economic agenda. That could include additional tax legislation, spending priorities, and policies favoring deregulation and domestic energy production. Markets might initially welcome the continuity, particularly in industries that benefit from those policies. However, concerns surrounding federal deficits, tariffs, and inflation could continue weighing on investor sentiment.
If Democrats gain control of the House while Republicans retain the Senate, legislative gridlock becomes more likely. Major new legislation could face greater obstacles, and congressional oversight of the administration would likely intensify. Some investors might welcome the reduced likelihood of significant policy changes, while others could become concerned about budget negotiations and potential government shutdowns.
A Democratic victory in both chambers would create even greater obstacles for the administration’s legislative agenda. However, existing tax policies and many regulatory decisions would not automatically disappear. Investors would still need to evaluate which policies could realistically change and which would remain in place.
The interesting thing is that none of these outcomes guarantees a particular direction for stocks or bonds. History offers an important reminder. According to research from U.S. Bank, stocks have historically produced an average return of approximately 12.4% during the 12 months following midterm elections. But averages are not guarantees, and the economy, corporate earnings, interest rates, and investor expectations often matter more than which party controls Congress.
For firms like ours, which follow a systematic investing process, this uncertainty illustrates what we believe is one of the greatest advantages of our investment philosophy: we don’t have to predict who wins the election — or how markets will react to the results. Our investing process is designed to evaluate what markets are actually doing rather than what we believe they should do. If election results spark renewed optimism and sustained advances in equities, our strategies are designed to participate in favorable trends. If uncertainty leads to additional weakness, our systematic risk management process is designed to recognize deteriorating trends and adjust exposure accordingly.
Of course, that doesn’t mean avoiding every decline. Trend following is inherently reactive, meaning some weakness must occur before a meaningful trend change can be confirmed. But that discipline helps prevent emotional decisions driven by headlines, political preferences, or short-term market volatility.
Ultimately, a client’s financial goals don’t change depending on which political party wins an election. Neither should the discipline of the investment process designed to help them achieve them.
On Nov. 3, voters will decide who controls Congress. In the weeks and months that follow, markets will decide what those results are worth. We don’t need to predict either outcome. We simply need to follow the trends that emerge.
Sourcing for this section: finance.yahoo.com, “The S&P 500 Just Reached a New Record. Here’s What History Says About Buying Stocks Now.,” 10/7/2026; https://portfolio-terminal.com, “The S&P 500 closes at a record with the 10-year at 5.27%, a first since 2007,” 10/7/2026; and usbank.com, “How midterm elections affect the stock market,” 10/28/2026
Let's Talk
If you have any questions about what transpired in the markets last month or portfolio positioning for the month ahead